Communications
Metrics and Deliverability
Email results for an event are in Manage > Reports > Email. The page counts email activity reported back by the email provider for that event, over a window you choose, and lets you narrow to a single send. Per-send detail, including a per-recipient delivery log, is under the event's Communications > History tab.
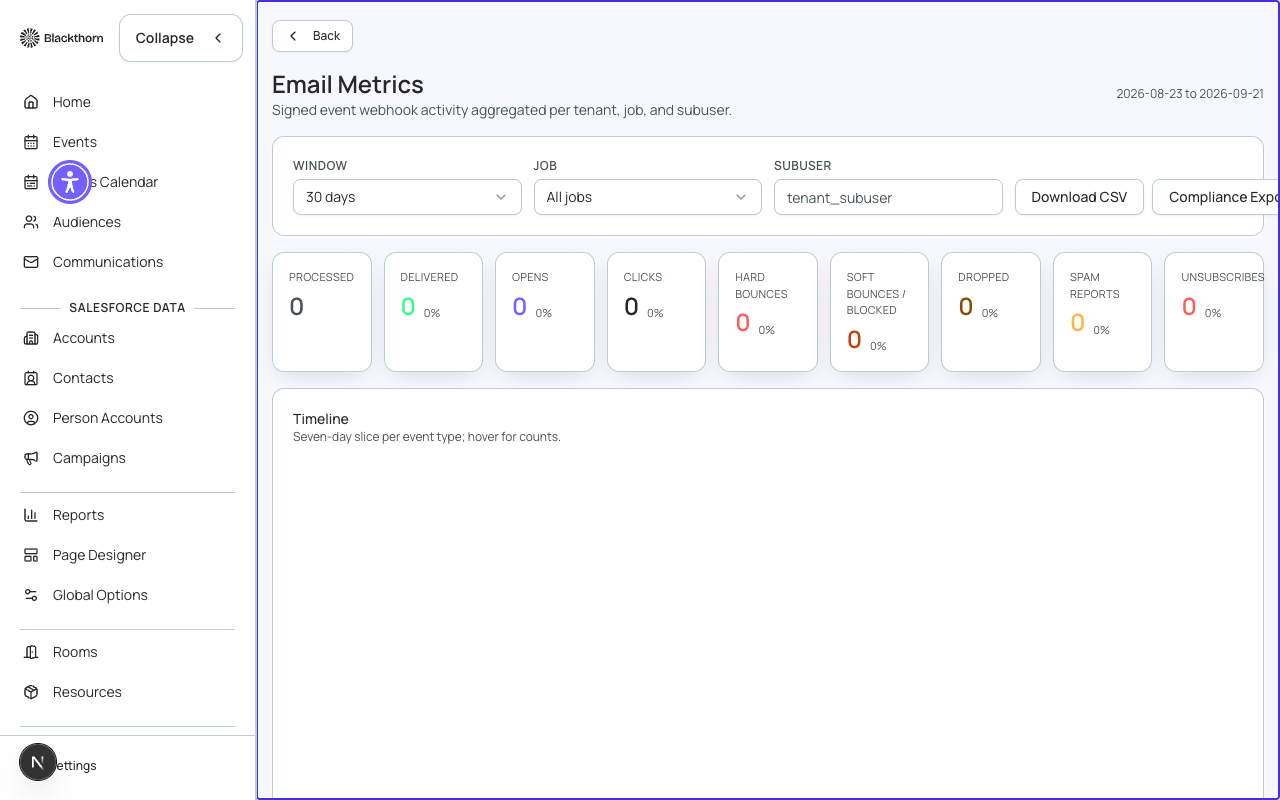
Metrics appear after you send a message from the Compose tab. Until then the page shows No data yet. Metrics are kept for 90 days, which is also the longest window you can choose.
Filters and controls
| Control | What it does | Recommendation |
|---|---|---|
| Window | How far back to look: 7, 14, 30, 60, or 90 days. Default 30. | Use 7 days right after a send; 30 to 90 for trends. |
| Job | Limits the page to one send. All jobs shows everything for the event. Sends are listed by name and date. | Pick one send to compare it against another. |
| Download CSV | Exports the current view as a CSV file named for the window, for example email-metrics-event-30d.csv. | Use it for reports you share outside Forge. |
Metric cards
Each card shows a count and, where relevant, a rate. Rates are worked out from the counts in the window.
| Card | What it counts | Rate shown | What to do |
|---|---|---|---|
| Processed | Messages the email provider accepted from Forge to attempt. | None. | This is the base for most rates. If it is zero after a send, check Admin > Email readiness. |
| Delivered | Messages accepted by the recipient's mail server. | Delivered divided by Processed. | A healthy list is close to 100 percent. A low rate means bounces or blocks; see below. |
| Opens | Open events recorded for the messages. | Opens divided by Delivered. | Treat as an estimate. Many mail apps preload images, which inflates opens. Use Clicks as the steadier signal. |
| Clicks | Click events on links in the messages. | Clicks divided by Delivered. | Compare clicks across sends to see which content works. |
| Hard Bounces | Permanent failures, such as an address that does not exist. | Hard bounces divided by Processed. | Correct or remove those addresses. Repeatedly mailing a bad address hurts your sender reputation. |
| Soft Bounces / Blocked | Temporary or recipient-side failures, such as a full inbox or a server that refused the message. | Blocked divided by Processed. | Usually nothing to do. If one domain keeps blocking you, check that your sending domain is verified. |
| Dropped | Messages Forge's provider did not attempt, for example because the address was invalid. | Dropped divided by Processed. | Check the address and the suppression list in Admin > Email if you expected delivery. |
| Spam Reports | Recipients who marked the email as spam. | Spam reports divided by Processed. | Keep this very low. Review who you send to and make the unsubscribe link easy to find. |
| Unsubscribes | Recipients who unsubscribed from this email. | Unsubscribes divided by Processed. | A spike means the audience or content missed. Narrow the audience next time. |
Opens are not a reliable engagement measure. Apple Mail Privacy Protection and some security scanners load tracking images automatically, so open counts can be much higher than real reading. Judge a campaign by clicks, replies, and registrations.
In Salesforce, the bounce count recorded against a send combines hard bounces and blocks into one counter. Forge shows them separately.
Timeline, alerts, and job performance
| Section | What it shows | How to use it |
|---|---|---|
| Timeline | A chart with one line per event type (processed, delivered, open, click, bounce, and so on) per day, so you can see when activity happened. Hover for counts. | Look for the day a send went out and how quickly opens and clicks followed. |
| Anomaly alerts | Days when a rate moved the wrong way compared with the recent average. Each alert shows the metric, the day, the current rate, the baseline, and the difference. Warning is 15 percentage points worse; critical is 30. For delivery, open, and click rate worse means lower; for bounce rate worse means higher. The baseline is the average of up to the previous seven days and needs at least three earlier days of data. | Investigate a critical alert the same day: check the sender, the audience source, and recent list imports. |
| Job performance | A table with one row per send: Processed, Delivered, Open %, Click %, and Bounce %. Click a column heading to sort; the default is Processed, highest first. | Compare sends side by side to find the best subject lines and send times. |
Per-send detail and send confirmation
- History tab: each send shows status, total sent, failed, run history, recent logs, and a per-recipient delivery log. Use the delivery log to confirm whether a specific person received a message.
- Before a send, the confirmation dialog estimates how many recipients will actually receive it after suppressed and bounced addresses are removed, and warns when more than one in four addresses are inactive. Treat that warning as a prompt to clean the list first.
What keeps deliverability healthy
| Practice | Why it matters | Where |
|---|---|---|
| Verify your sending domain | Inbox providers trust mail from a domain you have proven you own. Until it is verified, bulk sends are blocked. | Admin > Email: add the DNS records, then check again. Each record shows pending until the provider sees it, then verified. |
| Use a recognizable From name and a monitored address | People open mail from names they know, and replies reach someone. | Admin > Email and the event's sender. |
| Keep lists clean | Mailing unknown or old addresses raises bounces and spam reports. | Review inactive addresses; the send confirmation warns above 25 percent. |
| Make unsubscribing easy | Recipients who cannot unsubscribe mark mail as spam instead. | Add the Unsubscribe and Manage Preferences links in the editor. |
| Send consistently | Sudden jumps in volume look suspicious to mail providers. | Schedule large sends in steps; each organization is limited to 100,000 emails per day. |
As a rule of thumb, aim for a delivery rate in the high 90s, a hard bounce rate of about 2 percent or less, and a spam report rate well under 0.1 percent. These are common industry targets, not limits Forge enforces; your own trend over time matters more.