Global Tour
Reporting
Reports (Reports in the left sidebar) is the cross-event dashboard. It answers portfolio questions such as how many people registered, how much was ordered, how much cash came in, which events are nearly full and which sessions are at risk. Each event also has its own Reporting tab with deeper per-event detail. When enabled for your organization, Reports > Umbrella also shows each umbrella's revenue split between bundles and à la carte, its bundle attach rate, and, per event, how full it is, its waitlist and check-in progress.
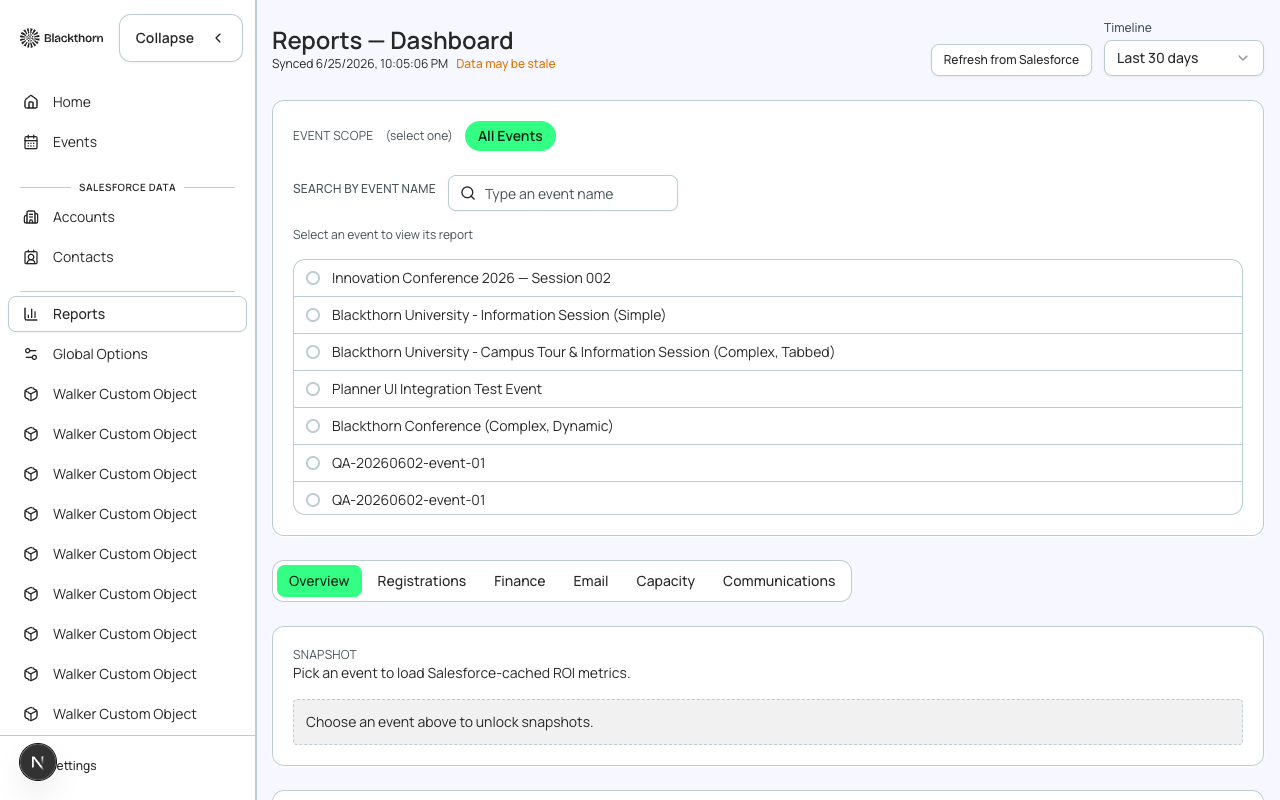
Filters at the top
| Control | What it does | Recommendation |
|---|---|---|
| Refresh from Salesforce | Re-reads the dashboard data from Salesforce, scoped to the event and timeline you have selected, and refreshes the single-event Snapshot too. The page shows Synced <time>, and Data may be stale when the stored copy is old. | Refresh before a meeting or after a burst of registrations. The numbers are a stored snapshot, not a live query. |
| Timeline | Last 7 days, Last 30 days (default), Last 90 days or All Time. | Use 7 days to see what changed this week. It only moves the trend charts and the windowed revenue figure; tiles marked All time never change with it. |
| Event scope | All Events by default. Type in Search by event name and pick one event from the list (shown 25 at a time, with Show more) to scope the page to that event. Active filters appear as removable chips, with Clear filters when there are two or more. | Pick one event to see the Snapshot; stay on All Events for portfolio rollups. If a new event is missing, choose Refresh events. |
Your filter choices are saved for you. If saving is unavailable the page says Filter preferences are temporarily offline and keeps them in this browser only.
The six tabs
Overview
| Block | What it shows | How to use it |
|---|---|---|
| Snapshot (one event selected) | Registrations to date with fill rate (N% of capacity seats, or Capacity not set), Revenue to date with total orders, Cash collected with the outstanding amount, and Avg order value with paid conversion. A Cached time and Refresh recommended flag show age. Open reports jumps to that event's Reporting tab. | To achieve a quick health check on one event, select it here instead of opening the event. |
| Business impact (All Events only) | Pipeline, Won, Deals and Accounts totals, Pipeline by event, and Top accounts. It needs Campaign Sync on your events; otherwise it prompts you to set it up. Hidden when a single event is selected because the data is tenant-wide. | Use it to show what events contribute to Salesforce opportunities. |
| Five stat tiles (All Events only) | Events, Registrations, Revenue, Paid orders, Emails scheduled. All are all-time totals except Revenue, which switches to the selected Timeline window and is labelled with it. | Read the label on each tile: All time means the Timeline filter does not apply. |
| Revenue chart | Daily revenue for the selected scope and range, with Export CSV. | Look for dips after a campaign ends. |
| Top events by revenue | A table with Event, Registrations, Revenue and Paid Orders, all time. | Use View reports to open the event. |
Registrations
| Block | What it shows |
|---|---|
| Registrations funnel | Counts per registration status stage: Lead, To Invite, Invited, Pending, Registered, Declined, Canceled, each with its percent of total attendees. All time, regardless of Timeline. |
| Registration status mix | A table per event with Registered, Pending, Waitlist and Other columns. Columns follow your org's registration status picklist. View attendees opens the list. |
| Event daily trends | Registrations and revenue per day over the trend window (7, 30 or 90 days; All Time uses 365). Registrations use their own scale, separate from revenue. |
Finance
| Block | What it shows |
|---|---|
| Revenue for the date range | Revenue for the selected range with Export CSV. |
| Finance: Budget vs Fees (Monthly) | Revenue, planned budget and platform fees per month, scaled to the largest value. |
| Mktg: Registrations by ticket type | Quantity and revenue per ticket type in the selected window, so you can see demand mix. Unassigned ticket groups sales with no ticket. |
| Finance: Event net revenue snapshot | Per event: Captured (cash collected), Refunds and A/R (amount still owed), all time. |
| Finance: Refund & A/R watchlist | The five events with the most outstanding A/R and the five with the most refunds, to chase collections and credit memos. |
Revenue here is the total of orders. Captured is the part of that which was actually paid. A/R is orders minus captured minus refunds, so authorized-but-not-captured amounts still count as owed.
With one event selected, the Email tab shows that event's delivery report (sent, opened, clicked, bounced). With All Events it only shows queued, paused and cancelled counts, because per-recipient tracking exists only per event.
Capacity
| Block | What it shows | Recommendation |
|---|---|---|
| Planning: Remaining spots by event | Capacity, Registered and Remaining per event. If capacity is missing it prompts Set capacity or Set ticket capacity, and Manage opens the event. | Sort your promotion effort by Remaining; set capacity so the numbers mean something. |
| Planning: Sessions at risk | Session, Track, capacity, registrations and remaining for every session, flagged at risk when remaining seats are 5 or fewer, or 10 percent of capacity, whichever is larger. | Move an at-risk session to a bigger room or open a second slot. |
Communications
Shows deferred sends by date, overlap impact (total recipients in overlapping send windows) and a breakdown of conflict reasons, for the selected range. It needs communications orchestration to be enabled; otherwise the tab says so.
Exporting
Charts and tables with an Export CSV button download exactly the rows shown for the current filters. The file name carries the report name and range. The exports are totals by event, day, month or ticket type and do not list individual attendees. For people-level lists, use the event's Attendees tab or an audience.
Common goals
| To achieve this | Do this |
|---|---|
| See this week's registrations | Timeline = Last 7 days, tab Registrations, Event daily trends. |
| Find events that are almost full | Capacity tab, Remaining spots, sort by Remaining. |
| Chase unpaid balances | Finance tab, Refund & A/R watchlist, then open the event's Finance tab. |
| Prove event value to sales | Overview with All Events, Business impact (needs Campaign Sync). |
| Report on one event in depth | Select it here for the Snapshot, then Open reports for the event's own Reporting tab. |
Custom Reports and Registration paths are optional features that appear only when an admin enables them from the Beta features page.
Figures come from Salesforce events, attendees, sales documents and transactions through Forge's cached dashboard. For custom analysis, build reports in Salesforce itself.