Event Tour
Reporting
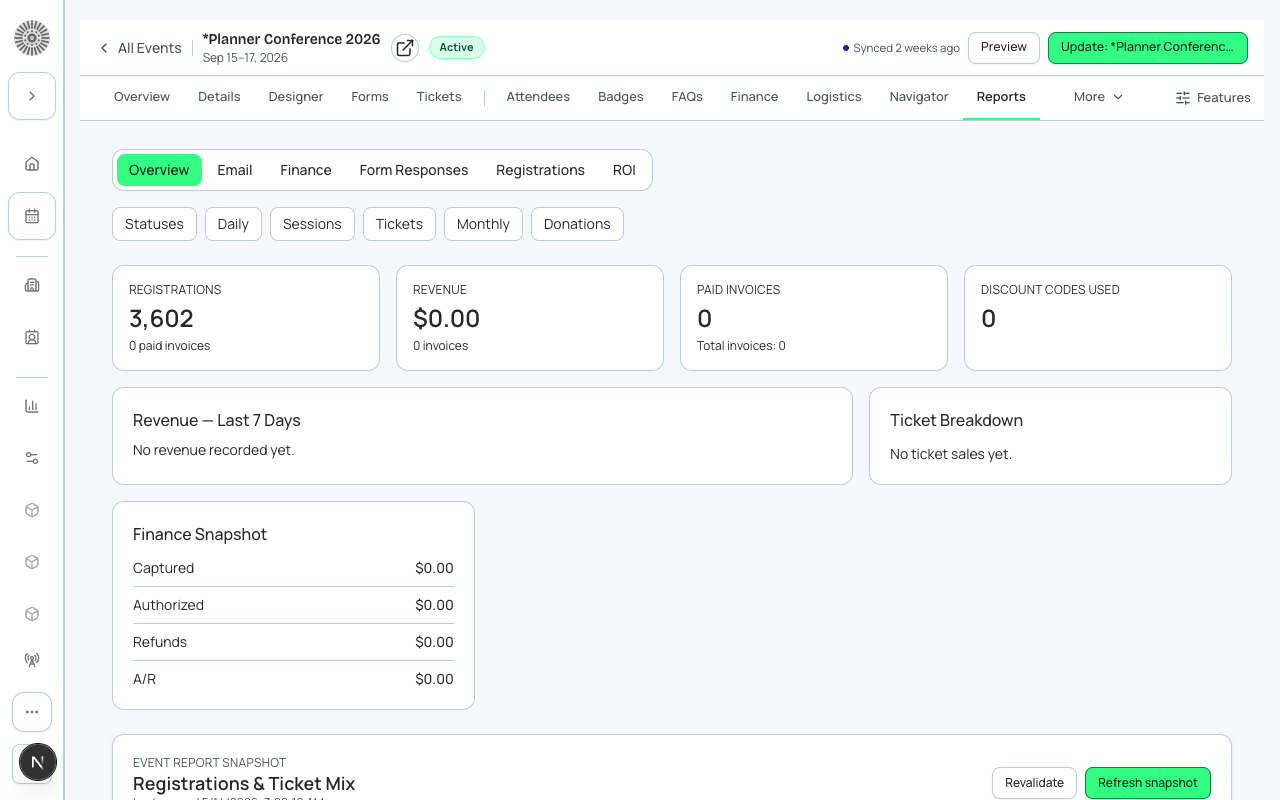
The Reporting tab (shown as Reports in the event workspace) gives you live numbers for one event across six sub-tabs: Overview, Email, Finance, Form Responses, Registrations and ROI. Use it to see how registration is trending, what is selling, how much money is in, and whether your email is landing.
Free events hide money. If the event has no paid items and no donations, revenue cards, the ticket leaderboard and the monthly rollup are hidden, and the Finance and ROI sub-tabs say 'Finance reports require paid tickets or donations on this event' and 'ROI metrics require paid tickets or donations on this event'.
A Refresh button at the top right of Overview, Registrations, Finance and ROI forces a fresh pull from Salesforce and shows the loading skeleton until it finishes. If a tab says 'Report data is loading. Please check back in a moment', Forge is still building the first snapshot for this event; try again shortly. Email and Form Responses read their own data and are not affected by Refresh.
Overview
| Section | What it shows | How to use it |
|---|---|---|
| Jump to links | Statuses, Daily, Sessions, Tickets, Monthly, Products and Donations. Tickets and Monthly only appear on paid events; Products and Donations only appear when the event has them. | Use them to skip down a long page. |
| Top metric cards | Registrations (with the paid-invoice count on paid events), Revenue (with invoice count), Paid Invoices (with total invoices) and Discount codes used. Below them, a Revenue chart ('Revenue - Last N Days'), a Ticket Breakdown list and a Finance Snapshot with Captured, Authorized, Refunds and A/R. | Watch Revenue against Paid Invoices: a wide gap means many orders are still unpaid. A/R is money authorized but not captured yet. |
| Event report snapshot (paid events) | A summary with a Registrations timeline (daily bars with a cumulative line; weekly totals when the event spans more than 120 days), Weekly registrations with a smoothed trend, Revenue by ticket type, and Registrations by ticket type. It shows 'Last synced' with Revalidate and Refresh snapshot buttons; the first time you may need to choose Refresh snapshot to generate it. | Use the timeline to see what each email send or deadline did. Peaks usually follow a send or an early-bird cutoff. |
| Sessions summary | Total sessions, Total registered, Total attended and Avg attendance, then the Top 10 most popular and Top 10 least popular sessions with Capacity, Registered and Attended columns, each with an Open session in Salesforce link. Long lists are limited to the first rows. | Move an oversubscribed session to a bigger room, and promote or merge the least popular ones. |
Report cards
A grid of cards sits under the metrics. Each has an information tooltip that says what it measures. Registration cards count every attendee record for the event unless noted.
| Card | What it measures | Recommendation |
|---|---|---|
| Registration by Day | New registration records created in the last 14 days. | Compare to your send dates to see which message drove sign-ups. |
| Ticket Type Breakdown | Registrations per ticket type (top 8 shown). | If one ticket dominates, check price and capacity on the other types. |
| Check-in Rate | Attendees whose attendance status is Attended or Checked In, divided by all attendee records. | Check it on event day; a low rate early in the day is normal. |
| Revenue by Ticket Type | Captured revenue per ticket type; excludes refunds and pending payments. Hidden on free events and on the Registrations tab. | Use it to decide where to push marketing. |
| No-Show Rate | Attendees who did not check in, as a share of all attendee records. | It counts everyone who never checked in, including people who cancelled or stayed waitlisted, so read it after the event, not during it. Clean up cancelled records first for a truer figure. |
| Waitlist Conversion | Registered divided by Registered plus Waitlisted. Shows a dash when nobody is waitlisted. | If it is low and the waitlist is long, raise the capacity or release more seats. |
| Capacity Utilization | Attendee records divided by the event's capacity. Needs a capacity set on the event. | Set a capacity in Event Settings so you can see how full you are. |
| Discount Usage | Total number of discount-code uses. | Compare to each code's quantity to see which codes are working. |
| Comped Tickets | Complimentary tickets issued across ticket types. | Check it against your sponsor and speaker allotments. |
Detailed Breakdowns
| Section | What it shows |
|---|---|
| Statuses | Registrations grouped by their current registration status. |
| Daily | Daily new registrations and revenue over the last 14 days. |
| Ticket leaderboard (paid events) | Ticket types ranked by quantity sold, with a revenue-share bar. |
| Monthly rollup (paid events) | Revenue and registrations grouped by the month they were created. |
| Products & Add-ons | Name, Sold, Available (or Unlimited) and Revenue for each product or add-on. Shows 20 rows with Show more. |
| Donations | Total Raised and Number of Donations for the event's donation items. Shown even on free events. |
Admins see a Configure fields button on some report panels, such as Products and Registrations. It lets them choose and reorder the Salesforce fields shown as columns (up to 25), then Save.
Delivery and engagement for emails sent from this event, over the last 30 days by default. Filters: Window (7, 14, 30, 60 or 90 days) and Job (all sends or one send). Cards show Processed, Delivered, Opens, Clicks, Hard bounces, Blocked, Dropped, Spam reports and Unsubscribes, with rates where they apply. A Timeline shows daily event counts, Anomaly Alerts list auto-detected outliers in send volume, open rate or bounce rate, and Job Performance shows per-send processed, delivered, open %, click % and bounce %. Download CSV exports the figures.
| Metric | Meaning | Recommendation |
|---|---|---|
| Hard bounces | Permanent failures, such as an address that does not exist. | Remove or correct these contacts; repeated bounces hurt deliverability. |
| Blocked | Soft bounces and recipient-side blocks. | Usually temporary; a spike can mean a spam filter reacted to your content. |
| Dropped | Rejected by the email provider before a send was attempted. | Investigate if it is more than a few percent of a send. |
| Spam reports / Unsubscribes | Recipients who marked mail as spam or opted out. | Narrow the audience or lower frequency if either rises after a send. |
Until you send something from Compose, this tab shows 'No data yet'.
Finance
Money summary for the event: Revenue (total order revenue, with the number of orders), Captured (payments actually collected), Refunds, Accounts Receivable (authorized but not yet captured) and the authorized total. Monthly Performance charts revenue by month against budget. A Finance links section jumps to Invoices, Transactions and Budget & Expense. Use the Refresh finance data button to reload.
A large Accounts Receivable means payments were authorized but not captured yet. Open Transactions and capture them (or follow up with the payer) so the money actually lands.
Form Responses
For every form attached to the event (registration, per ticket, session, post-checkout and survey), the answer distribution: how many registrants chose each option, plus the count of text responses. Email report sends a copy of this report to one or more recipients you enter. Use it to learn things like how people heard about the event or which dietary options to order.
Registrations
Attendee statuses (a count per registration status) followed by the same registration analytics cards as Overview, without money. Below them is a list of attendees, 20 at a time with Show more, each with a checkbox. Selecting people opens a bar with Mark Registered, Mark Attended and Edit Fields for bulk changes.
Mark Registered and Mark Attended write to Salesforce straight away and change who receives automatic emails and who counts in the check-in rate. Double-check your selection first.
ROI
Pipeline and revenue influence for the event, based on the Salesforce Campaign linked to it. Panels include Stage Funnel (Opportunities grouped by stage), Account Engagement (accounts linked to attendees with open pipeline, won revenue and deals), Deal Velocity (stage changes and new deals in the 30 days after the event), Event ROI (pipeline influenced and revenue won against the event budget), Campaign Rollup (contacts, leads, opportunities and won opportunities) and an Attribution note. An Attribution note states which model was used: Campaign Influence (multi-touch, counting all contacts and leads on the campaign regardless of attendance) or Contact Role (single touch, tracing Opportunity contact roles back from attendees; Attended only when attendance status is available, otherwise All members).
If no Salesforce Campaign is linked to the event, ROI says 'Link a Campaign to this event to see pipeline impact' with a Set Up Campaign Sync button. Link a campaign when you create the event so attribution works from day one.
The numbers come from conference360__Attendee__c, bt_stripe__Transaction__c and conference360__Session__c in your org. For cross-event reports, dashboards or Einstein Analytics, use Salesforce reports directly.